Employee Retention with Predictive Analytics

When considering companies with a significant amount of employees, the process of effectively retaining employees is increasingly difficult and somewhat impossible to manage manually. Employee retention is one of the most matured fields to which predictive analytics has been applied. There are recorded instances where an algorithm has identified an employee's intentions to leave before that same employee consciously formed that opinion.
People are the most valuable asset of companies
The human resources area is synonymous with people management or even human talent management, becoming a very important concept for any company or organization. In order for there to be an efficient retention of talents, a careful and detailed analysis must be carried out, person by person, ensuring that each individual feels motivated and respected to do their work. When considering companies with a significant amount of employees, this process becomes increasingly difficult and somewhat impossible to manage manually.
Besides, companies can go through considerably lengthy and exhausting processes to hire and train employees who dedicate themselves to the company. Retaining this type of talent is of utmost importance, given that a high employee turnover rate can decrease the company's knowledge base, negatively affect the customer experience and lead to a breakdown and consequent reduction in performance and motivation. High turnover rates also bring financial complications, as there are significant costs associated with hiring and training employees. In addition, it is necessary to carefully manage a company’s staff since people are undoubtedly its most valuable asset.
With this, some questions arise: What are the reasons that lead employees to leave? How can we prevent this? How can we help people who have the power to make these decisions?
There are several reasons why employees leave a company, such as salary dissatisfaction, career growth stagnation, manager relationships, lack of appreciation, among many others.
The Artificial Intelligence Solution with Predictive Analytics
Artificial Intelligence is a man-made invention that learns from experience, mimicking human intelligence. Predictive analytics is a component of Artificial Intelligence that uses machine learning techniques to identify the probability of future results, based on historical data. This historical data is the foundation for good predictive analytics applications and is composed of large, and varied datasets.
In other words, predictive analytics answers the question of "if this has happened, what will happen?"
When it comes to predictive analytics, employee retention is one of the most matured fields to which it has been applied. There are recorded instances where an algorithm has identified an employee's intentions to leave before that same employee consciously formed that opinion. This is due to the many indicators provided by employees daily that are constantly monitored and fed to the machine learning algorithms. Team leaders can then use these predictions to avoid the departure of valuable assets by means of, for example, incentives, rewards, and recognition.
Most machine learning algorithms fall under three categories: supervised learning, unsupervised learning, and semi-supervised learning.
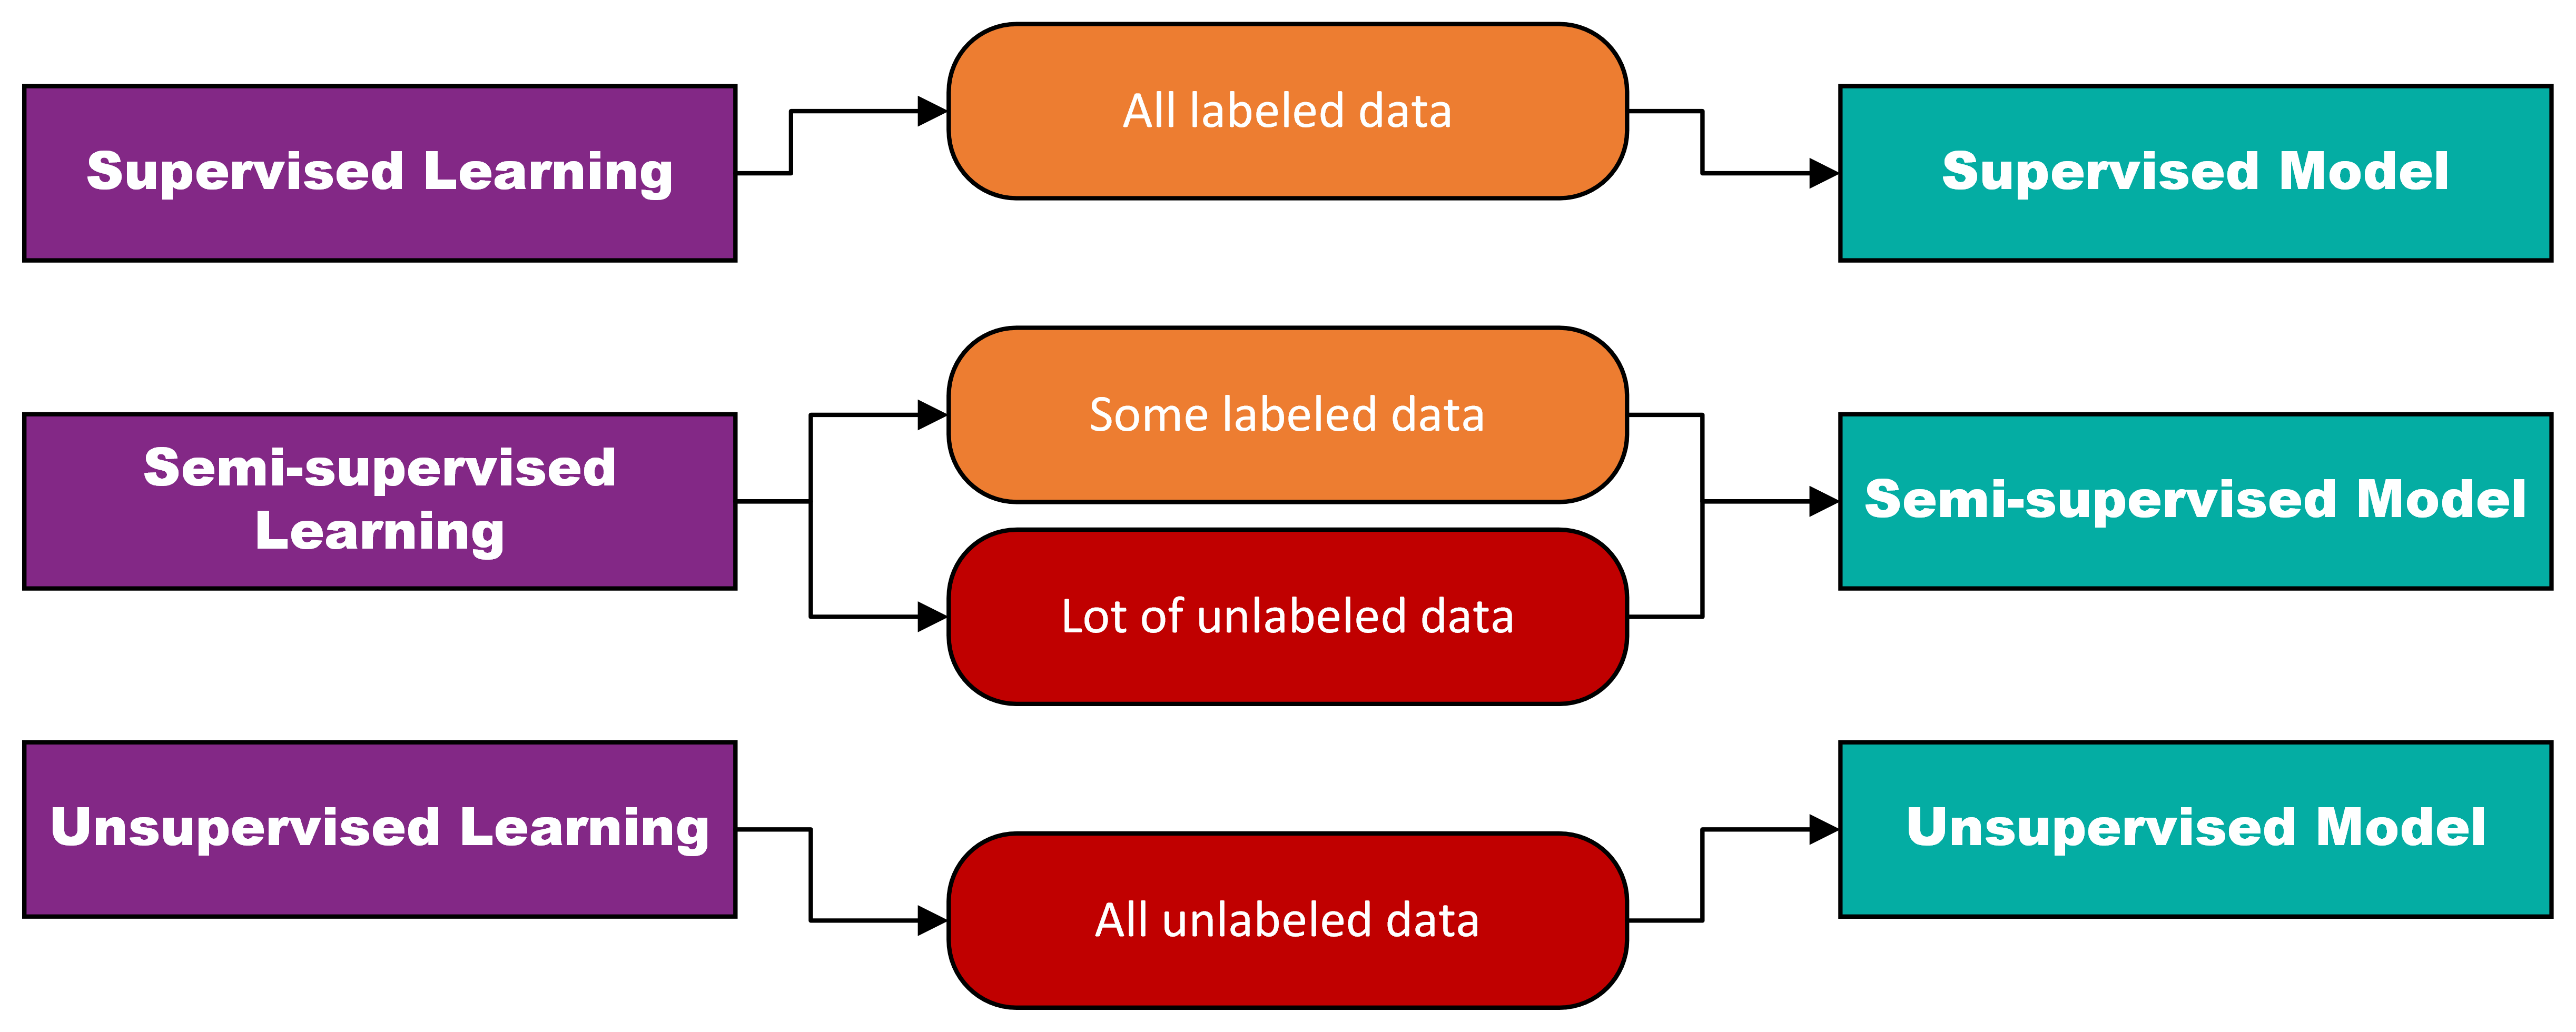
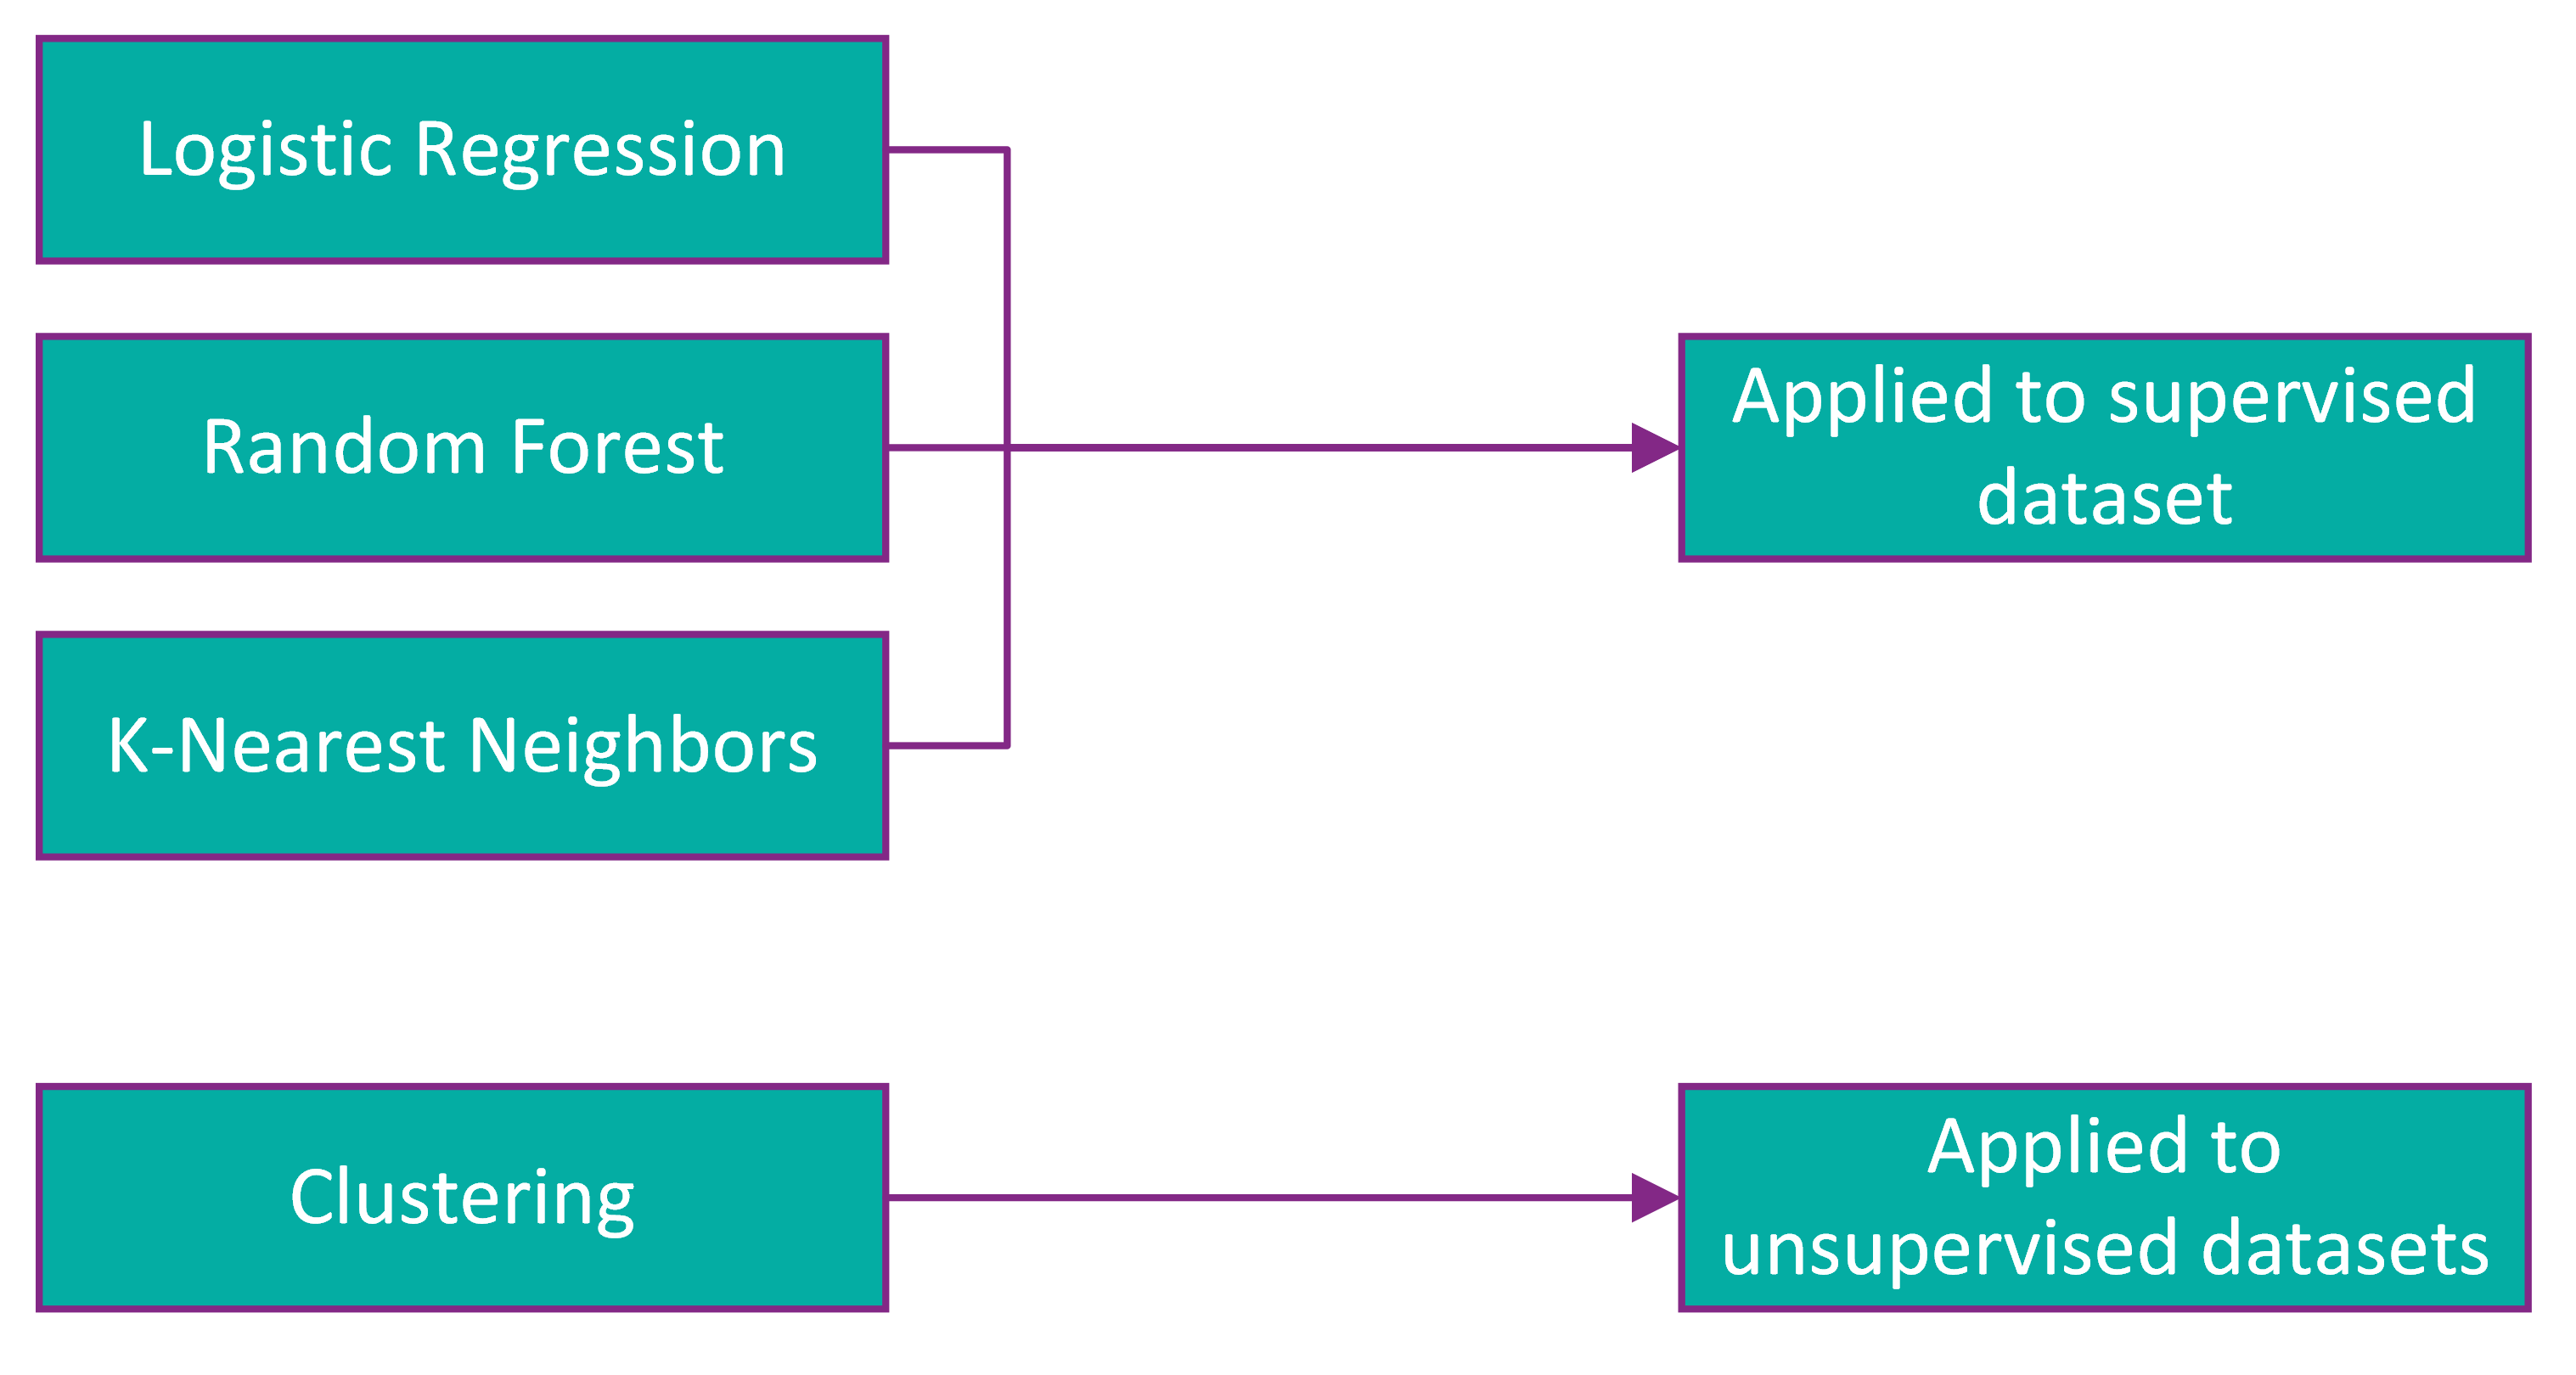
In supervised learning, both the input and output data are provided, and the machine must learn how to map the former to the latter. This is accomplished by feeding it a labelled dataset that contains multiple examples, making it easier for the algorithm to find patterns. Unsupervised learning lacks these same labels, leaving the machine with no examples or patterns, forcing it uncover them by itself. Finally, semi-supervised learning, in which the two previous types are combined, and the machine is typically fed a small amount of labelled data complemented by a large amount of unlabeled data. When using a supervised approach, techniques such as Logistic Regression, Random Forest and K-Nearest Neighbors can be applied. On the other hand, unsupervised datasets, which are the most common, make use of the clustering technique.
Requirements for the solution
There are some challenges when trying to make employee retention with predictive analytics work, two of which are computing power and datasets.
Computational capacity is very important to apply Machine Learning techniques given the amount of data being processed and the need for the algorithms to be efficient. In addition to that, having a clean, complete, and noise-free dataset is essential to achieve a reliable solution.
There are other issues when attempting this type of solution, for example, setting up clean and accurate data streams is, and will remain, a challenge for people analytics. Most of the big organizations have five to seven systems of record for their human resources data. This causes the input data of predictive analytics models to be inaccurate, affecting their results. In addition, important data on a given metric is often incomplete, resulting in that same metric being ignored.
Given the role and weight that data holds in the Machine Learning realm, it's important that organizations focus on data quality improvement.
The implementation of the solution
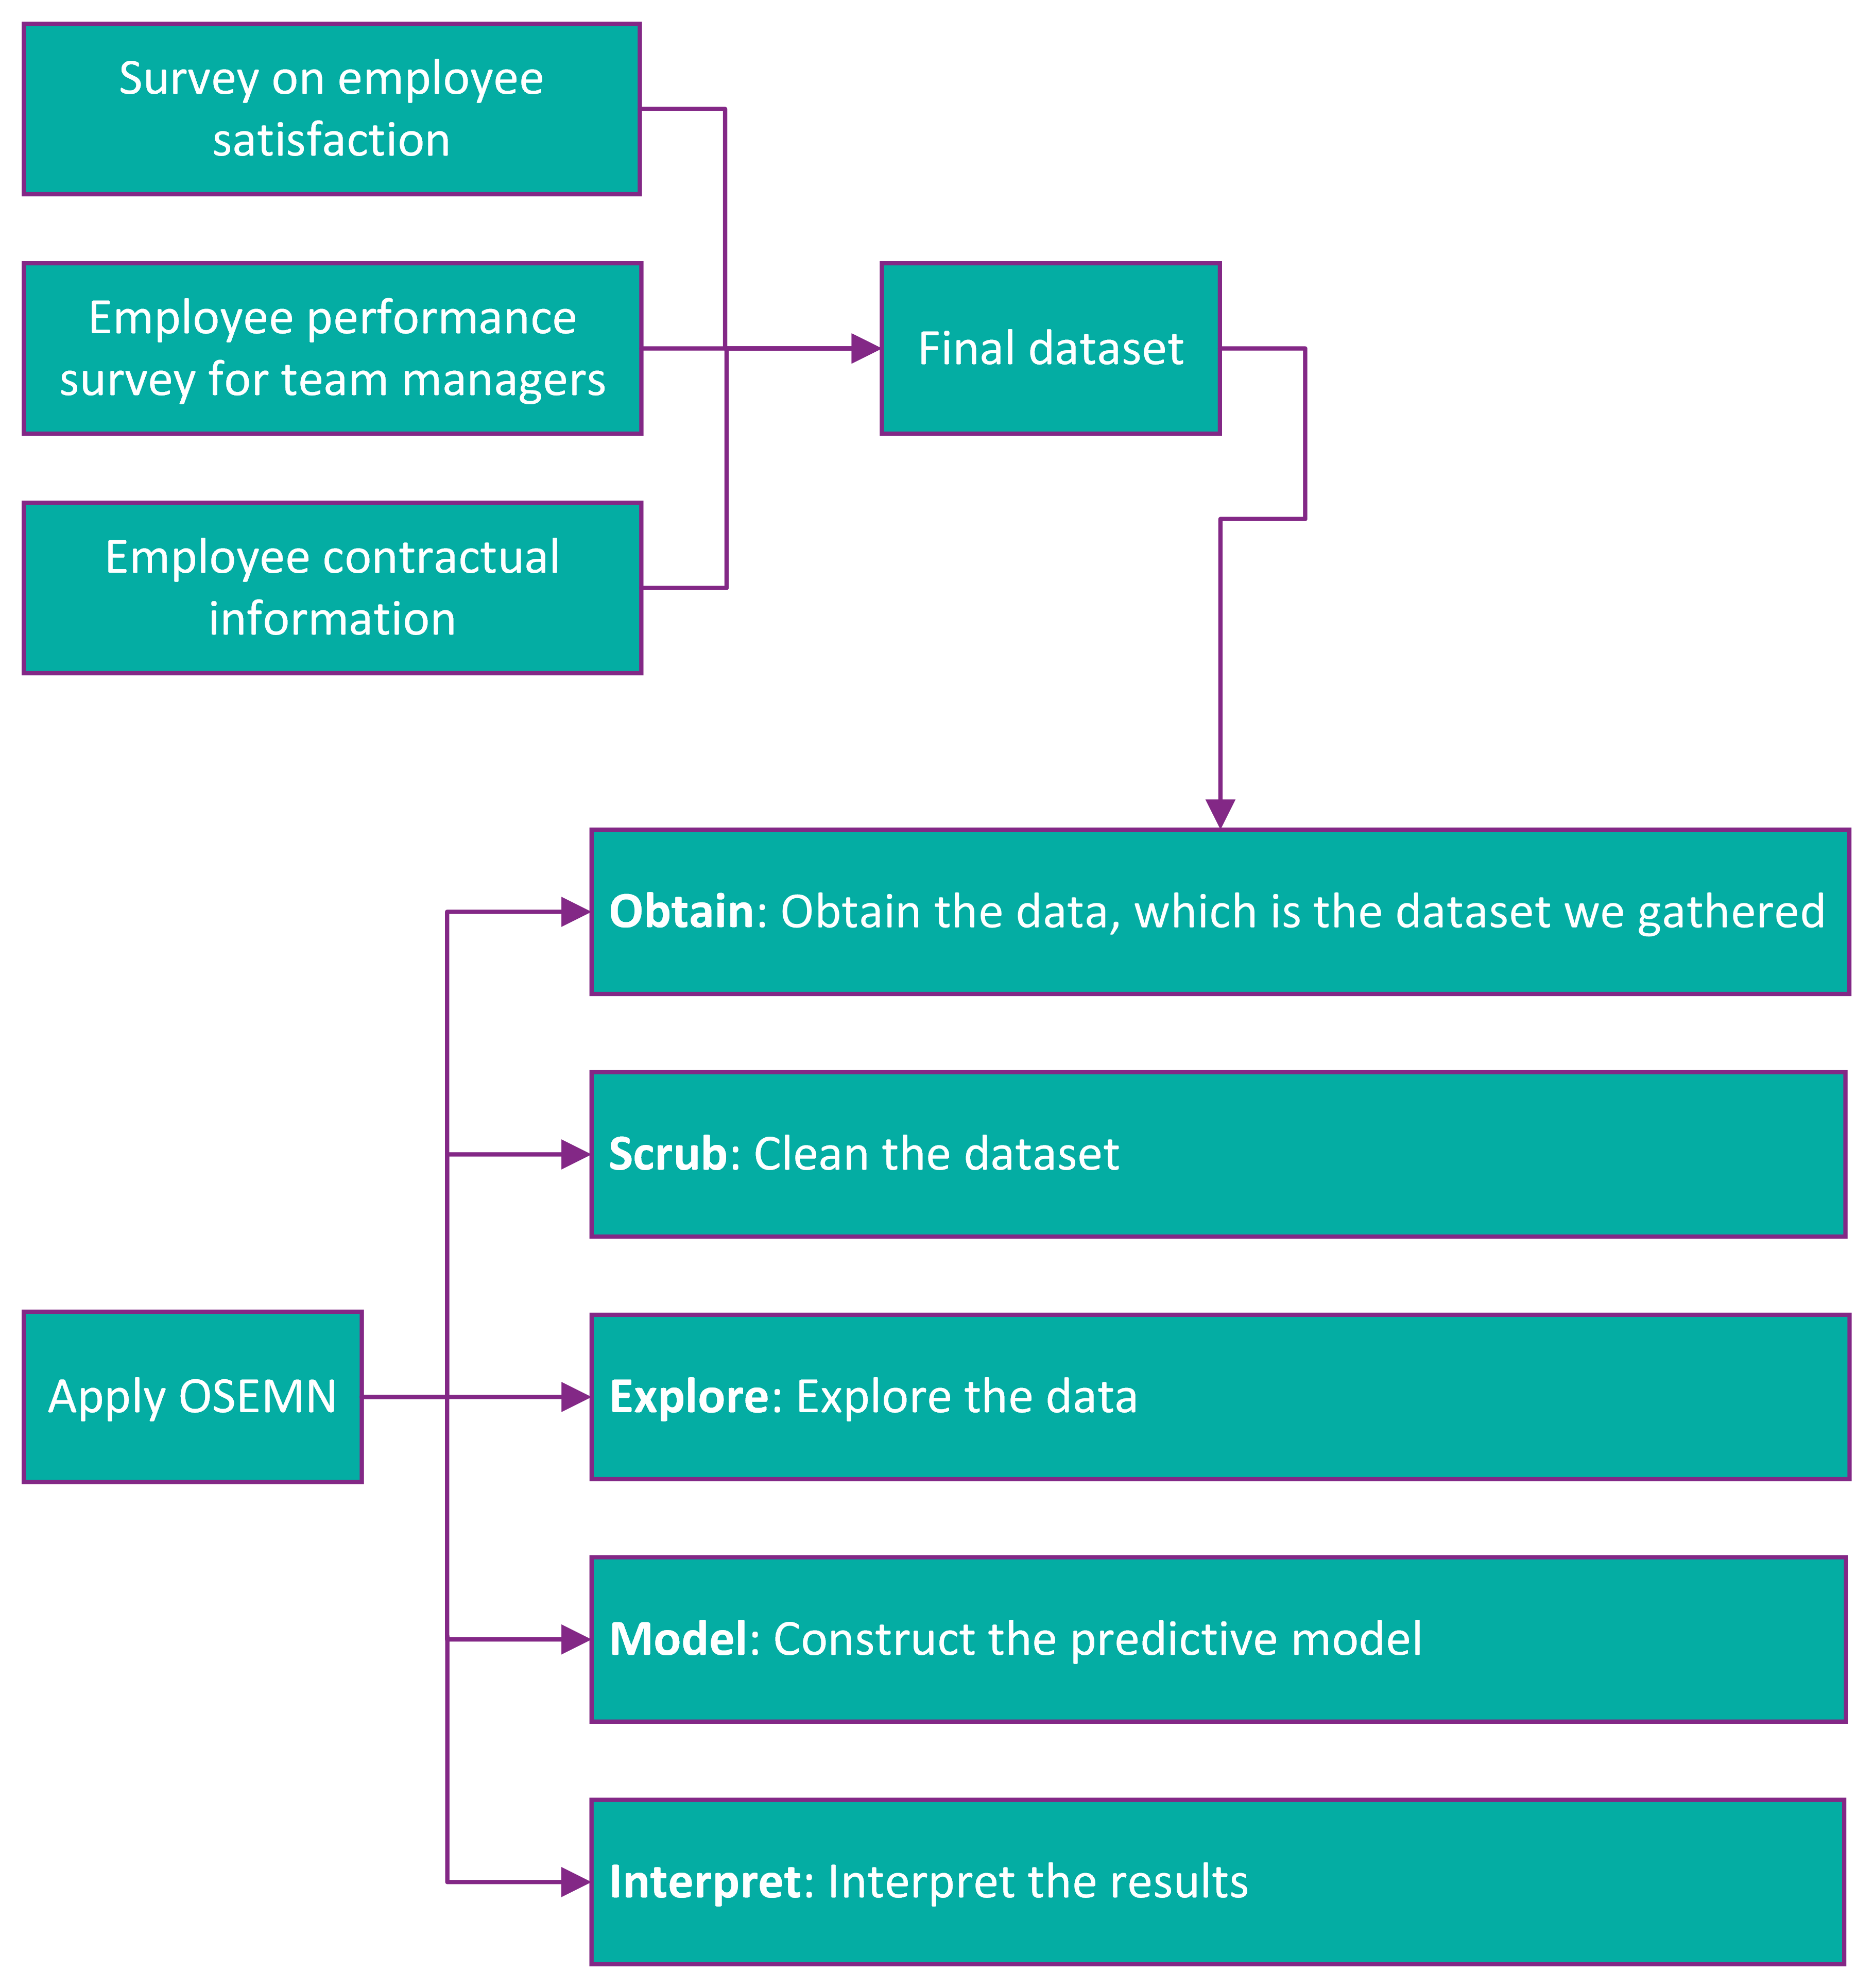
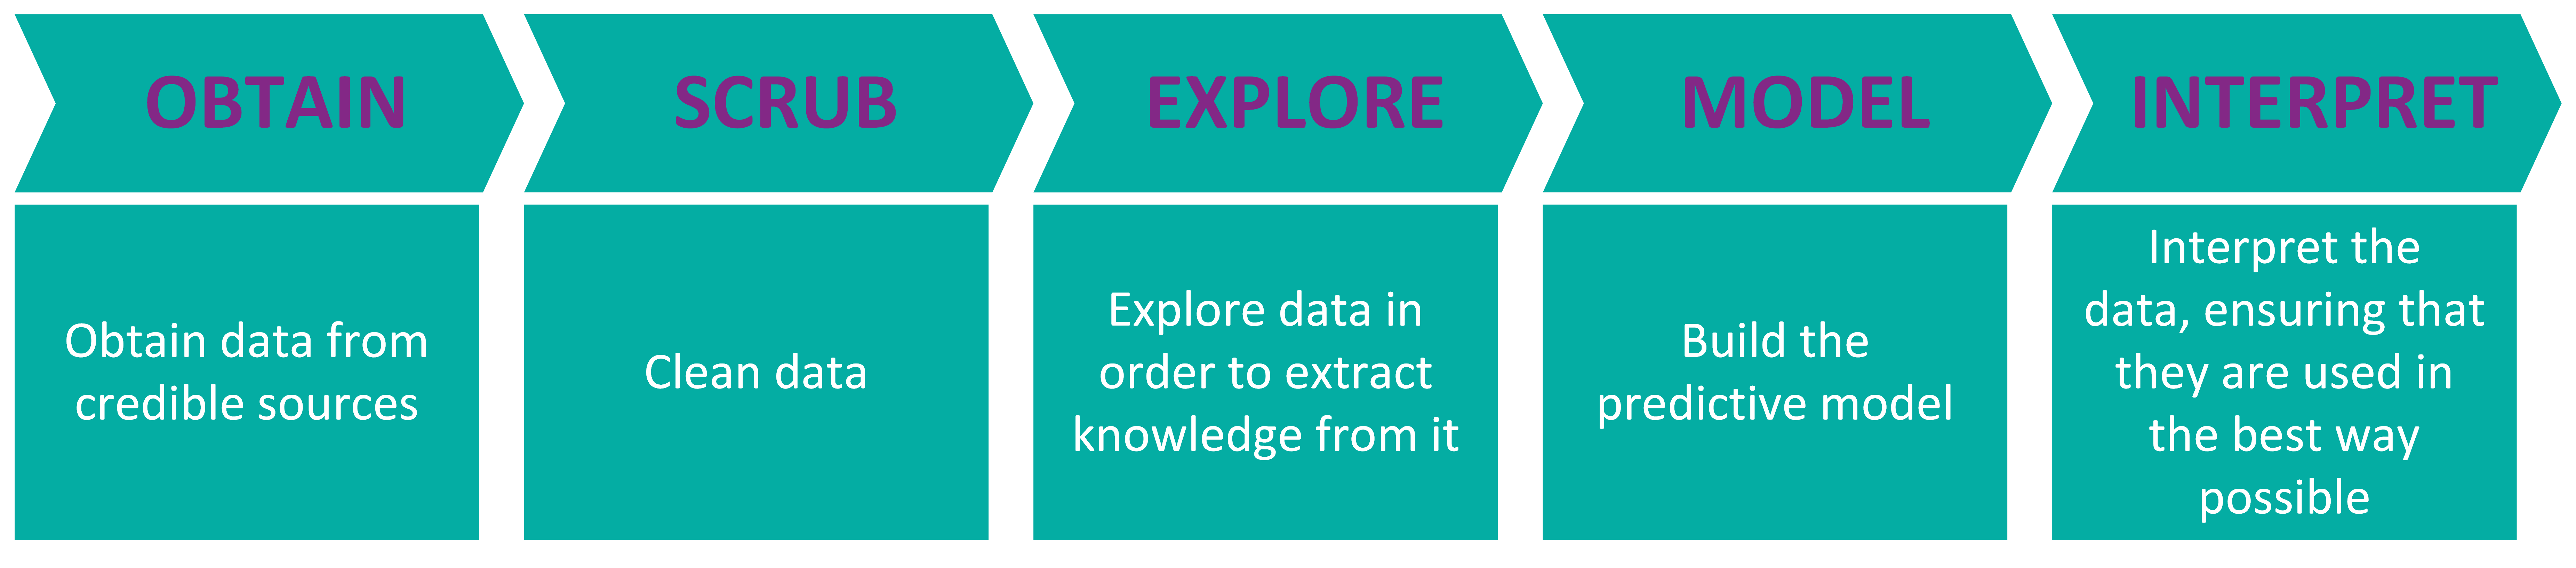
In the implementation phase, the OSEMN model was adopted, which consists of a pipeline used in data science that is divided into five stages. First, data is obtained from credible sources, then that same data is cleaned and explored to extract any possible knowledge from it. Next up, in the model stage, pre-processing and construction of the predictive model are carried out. Finally, results are interpreted, ensuring that they are used in the best way possible.
In order to obtain the data, it is necessary to collect information from companies about employees and also apply surveys to employees and team leaders.
The first dataset is a survey that is made to employees about their satisfaction in the work environment, which is divided into 5 sections:
- Employee identification
- Questions related to the project you are currently working on
- Questions related to your relationship with the team leader
- Questions related to the work environment
- Questions related to the company
The second dataset is a data survey that is presented to team leaders regarding the performance of their direct reports and contains questions such as:
- Number of years the employee has been with the team leader
- Employee performance evaluation
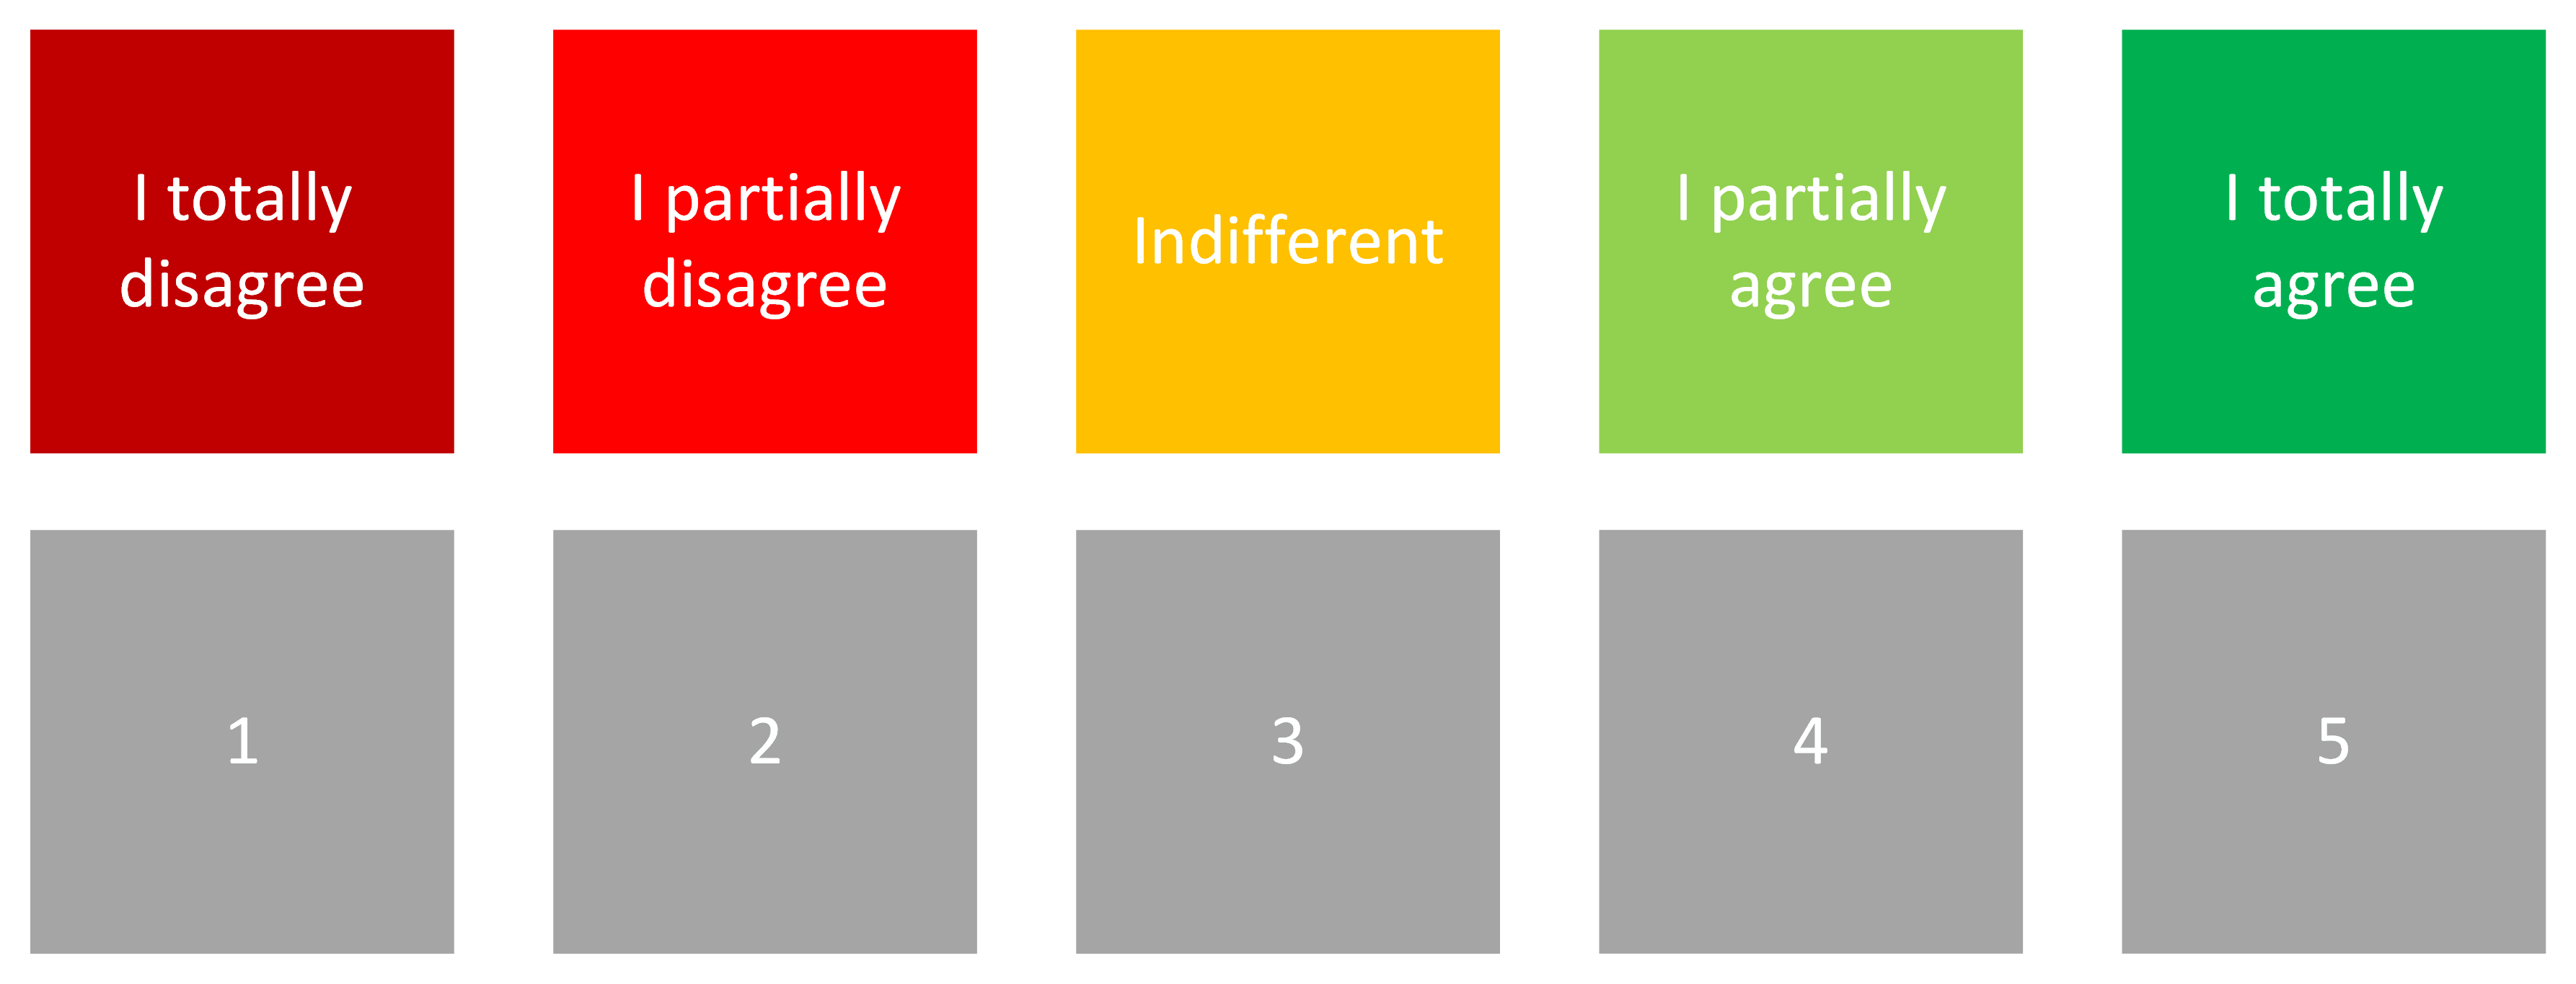
To scale the responses given on the survey, the Likert scale is used. It is comprised of a 1 to 5 response scale and often used in questionnaires with the aim of respondents specifying their level of agreement with a statement.
The third dataset contains the contractual information the organization has on each employee, for instance:
- Monthly salary
- Employee cost per month
- Percentage of salary increase
- If you are paid in shares
- When was the last promotion?
In this project where the model is being conceived and developed, as there is no access to real data from a company, it is necessary to create a fictitious and reliable environment. Therefore, two datasets were used. The first dataset is a supervised, dummy dataset created by IBM data scientists for the employee attrition problem. The second dataset is a generated, unsupervised, dummy dataset.
The idea of having two datasets is so that both the supervised and unsupervised approaches can be adopted, making it possible to extract knowledge from the behavior of the various techniques and assess which is the best way to reach the target (final output that will be predicted). Later, by removing the attrition label (true outcome of the target) from the supervised dataset, it becomes unsupervised, making it possible to test the techniques of the unsupervised model. This will cause a final validation of the model by means of the attrition label.
A detailed analysis of all attributes within both datasets was carried out in order to correlate them with the reasons that lead employees to leave organizations, reasons that were previously researched. Then, given that the dataset contained information that resided outside the scope of the issue, unnecessary attributes/fields were removed. On the other hand, some of the information required to match with the features being tackled in the surveys was missing, leading to the addition of said field and random data generation. This culminates in the “final” dataset that suits the issue.
In the scrub stage, the data needs to be cleaned up. To this end, it is necessary to check for missing or duplicated values and correct them.
After scrubbing, it's time to explore the data. The initial step focuses on the correlation matrix, looking at the attributes that are most positively and negatively correlated. Then, for each attribute that is relevant, analyze the histogram, minimum, maximum, mean and mode. With the supervised approach, it’s possible to check the relationship of certain attributes with employee attrition through charts to provide better data visualization. In the case of the unsupervised approach, although charts can be drawn to give a better sense of the data, it’s not possible to convey any relationship of attributes with the attrition since the latter does not exist in the dataset. By leveraging these charts, it’s easier to extract knowledge from the data, such as perceiving which attributes are irrelevant or redundant, detecting patterns, trends or even outliers.
Next up, the model stage was divided into two steps, pre-processing, and model construction.
Typically, machine learning algorithms can only have numerical values in their features, which they will use to make predictions. Pre-processing addresses this by encoding some attributes through various techniques. Label Encoding can be used for categorical attributes with 2 or less classes. Other categorical attributes are converted to dummy features, that is, features that only take the value of 0 or 1, which is similar to One Hot Encoding.
Model data also needs to be normalized to achieve better performance. On top of this, redundant attributes are removed (e.g., Employee Number) and, in the case of the supervised model, the label that states whether the employee left or stayed is also removed. Afterwards, the features should be analyzed against each other to determine their correlations, removing the ones that are highly correlated.
The next step is to build the models. In the supervised approach algorithms, the data is initially divided into training and test sets. After that, machine learning techniques can be applied to each approach.
To increase model performance, cross-validation is applied. It’s a statistical method used to estimate the skill of machine learning models.
Separating the data into only two disjoint parts can bring divergent results, depending on the information contained in each set. The k-fold cross-validation approach minimizes these problems. The method consists of dividing the data into K equal parts, the model is adjusted using K−1 parts, and the remainder is destined for validation. This process is repeated K times and each time a different partition is used as the validation. In the end, the results are combined obtaining the average count of errors.
With this the question arises, but what will be the value of k? First, the value of k can never exceed the amount of data in the dataset. Also, the higher the value of k, the higher the computational cost. On the other hand, the value of k cannot be too low either due to bias or variance. That said, the choice of k will be a compromise between computational cost, bias, and variance. For this model, a value of k=10 was chosen, which is commonly used.
Several techniques can be applied to the supervised dataset to see the behavior of the various techniques, but this is not the goal. In a real-world scenario, the output of the predictive model is not known before-hand, that is, it’s unknown whether the employee left the company or not. Therefore, the final model is generated for a dataset that is as close to reality as possible, discarding the supervised approach and leading up to the unsupervised model.
For unsupervised datasets, clustering is the technique to apply. Its goal is to generate three outputs that consists of three probability groups: high, medium, and low probability of the employee leaving the company.
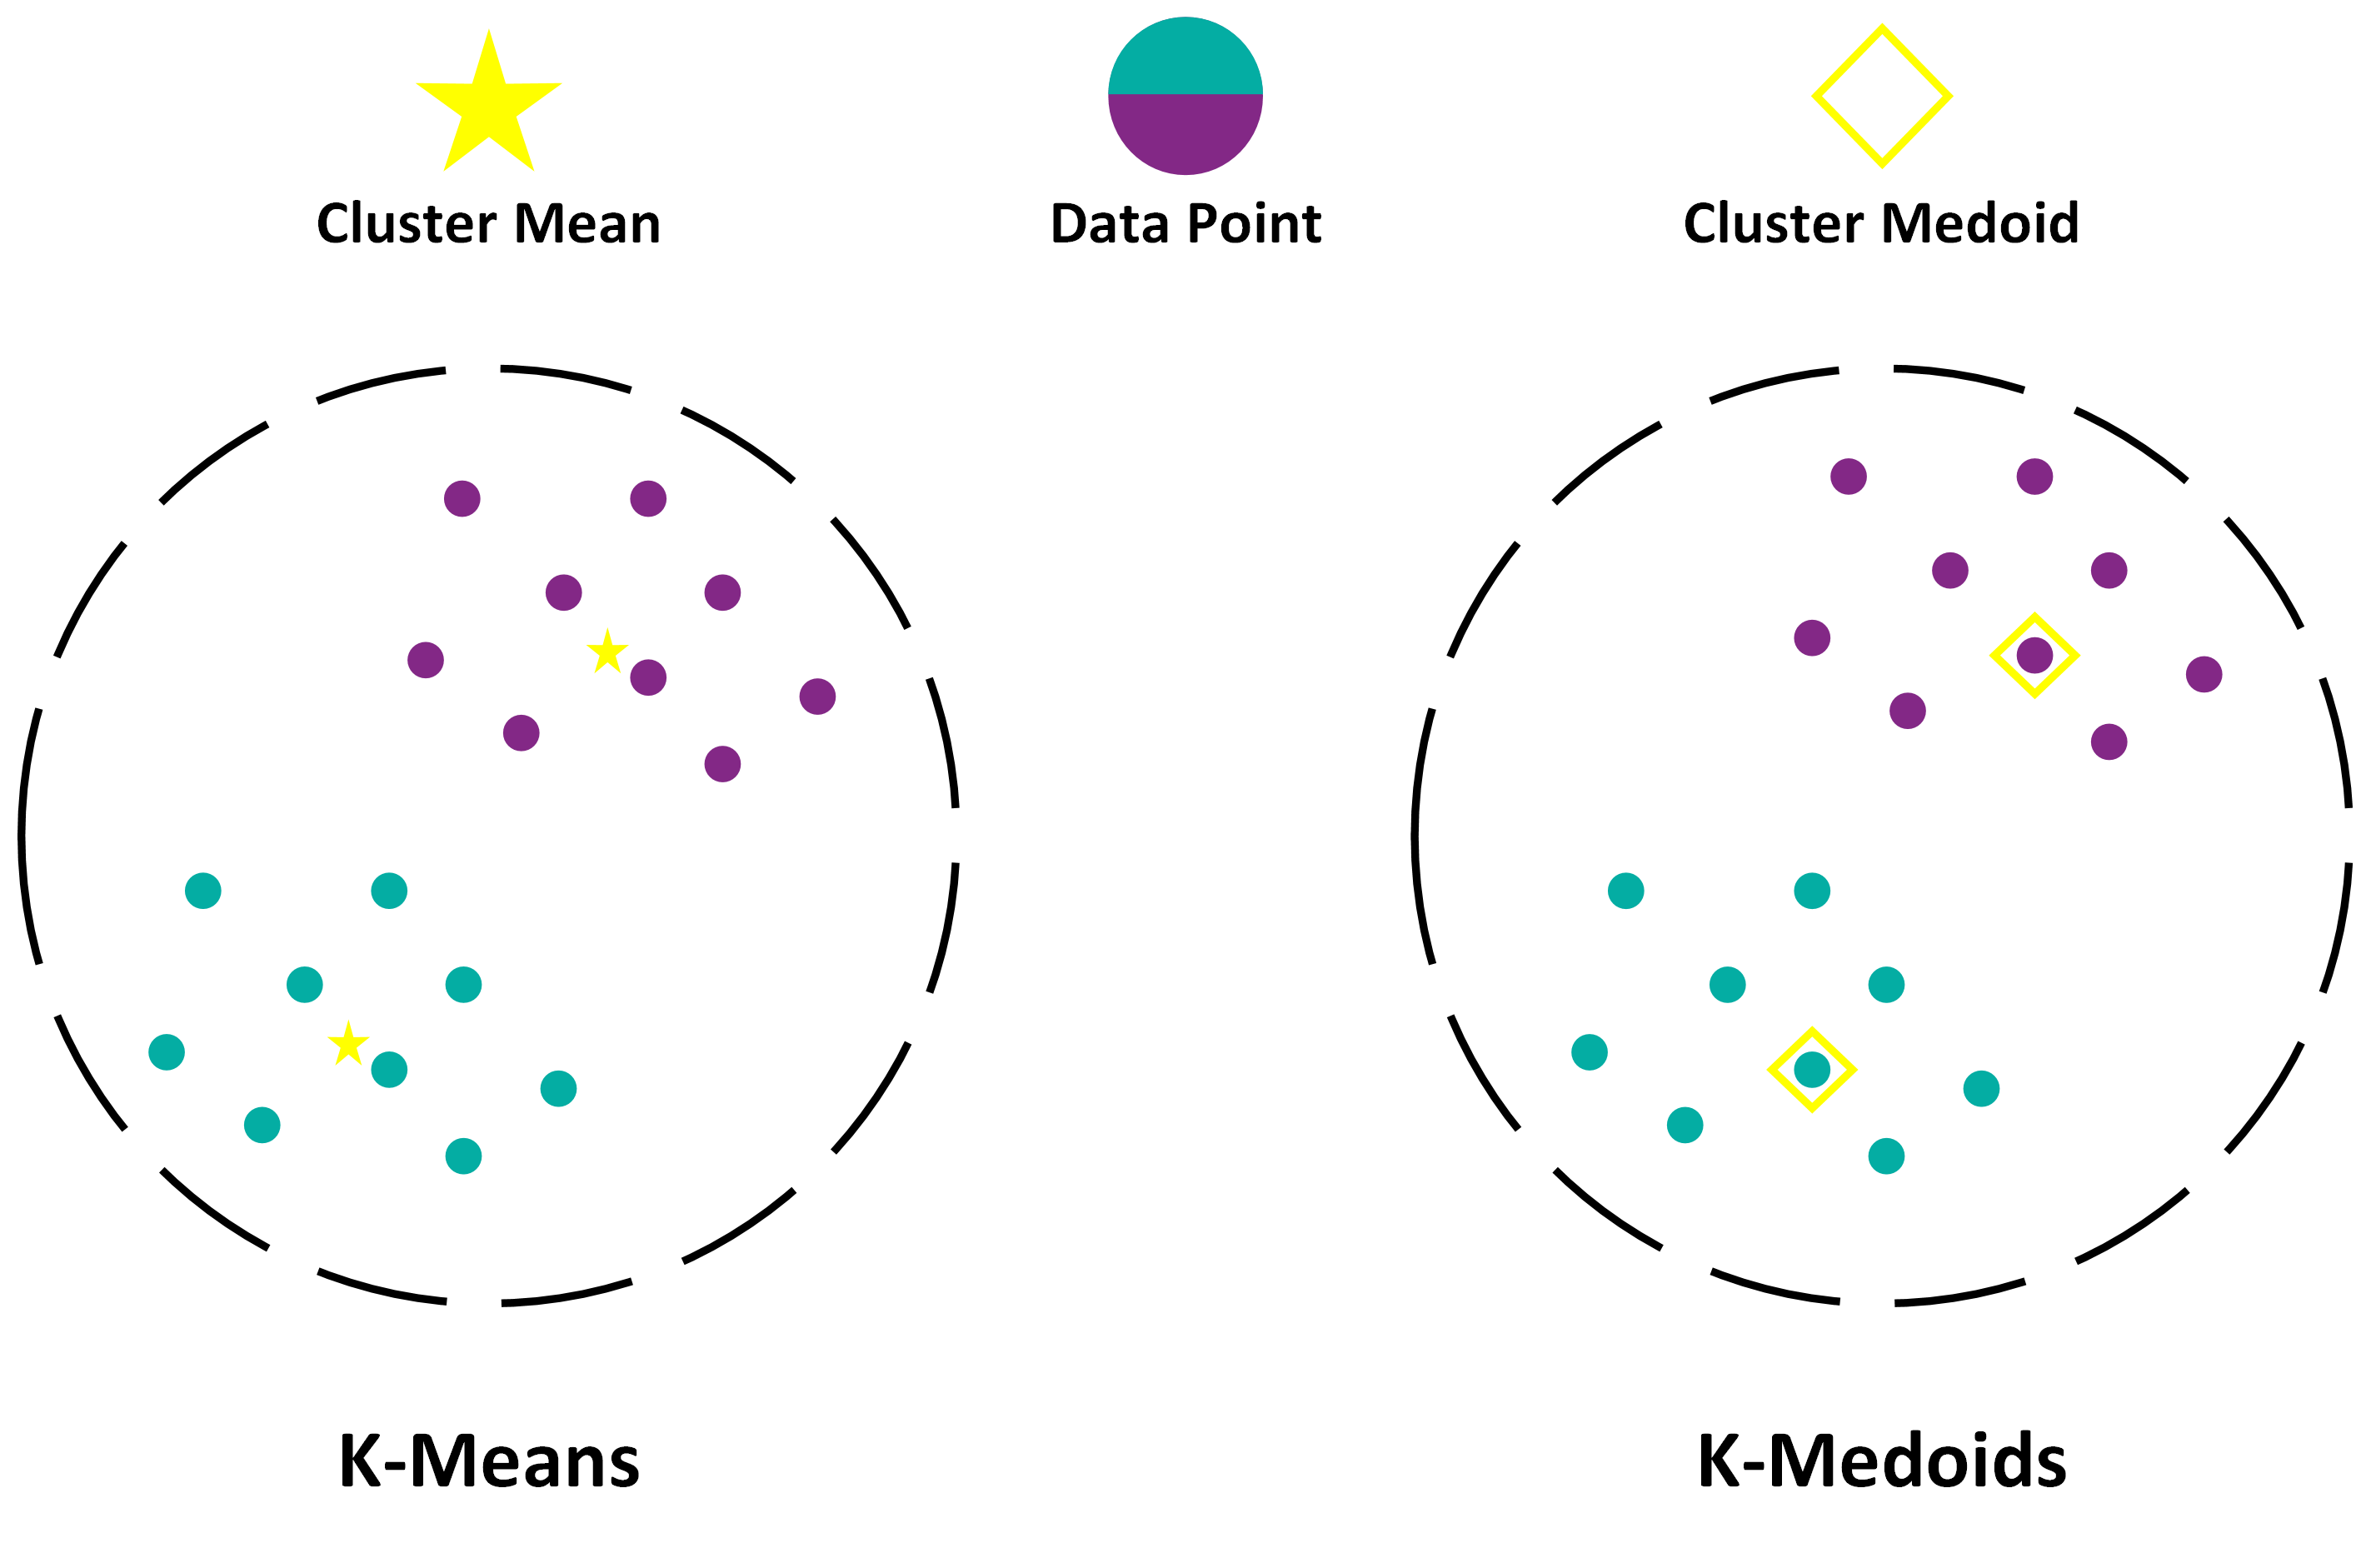
To achieve this goal, both k-means and k-medoids will be used with k=3, with the objective of seeing which algorithm best predicts the three probability groups.
The k-medoids algorithm is a clustering algorithm related to the k-means algorithm. Both the k-means and k-medoids algorithms are partitional. K-means attempts to minimize the total squared error, while k-medoids minimizes the sum of dissimilarities between points labeled to be in a cluster and a point designated as the center of that cluster. In contrast to the k-means algorithm, k-medoids chooses datapoints as centers (medoids). A medoid of a finite dataset is a data point from this set, whose average dissimilarity to all the data points is minimal, that is, the most centrally located point in the set.
In addition to this, the elbow method is applied to see the best k that fits this dataset and whether it makes sense to have three groups or to have less or more groups.
After the idealization and development of the model, it is necessary to put the data to good use. Bearing in mind that what is generated from the models are groups, the information is easily delivered to the human resources staff so that they can prepare a strategic plan for each group to make good decisions and retain the employee.
There are also some pertinent notes on employee retention.
It’s important to note that not all employees are worth retaining. Companies should not dedicate their resources to retaining all employees. There are several reasons for this, namely the existence of employees who leave the company regardless of what they’ve been offered, employees that the company itself does not want to keep (either because of their attitude or their performance), among others.
Another important observation, and one that goes against what people deem as a common understanding, is that current data suggests that employees leave their jobs for salary reasons less often than we think. This leads to the conclusion that companies can decrease employee turnover without having to turn to salary increases all the time.
There are also flaws worth mentioning, specifically outliers. One example consists of overly qualified employees that decide to leave the company, whether it be for a better opportunity or to open their own business. This is an extremely difficult exit to predict as these employees generally have good conduct and deliver great results, making it hard to notice when they show signs of dissatisfaction. Other, more extreme outliers may consist of employees that fall sick or even pass away.